All uniqueness is not equal
A technical exploration of rarity within NFT & generative art drops
BACKGROUND
In case you missed it, the crypto community has exploded with interest in Non-Fungible Tokens (NFTs), a kind of digital asset that you can buy or sell using cryptocurrencies (a kind of digital money). Digital artists and collectors both latched onto this technology and used it to create artworks and collectible items that are basically things that exist on the internet and in blockchains for everyone to see and for one person to provably “own”.
Think back to Pokemon cards. They were a physical object that existed, that you could buy and sell, mostly for fun/enjoyment. But some Pokemon cards were more expensive than others, usually because they were cooler or rarer. Remember shiny Charizard? Last year someone bought it for $220,000. Many trading cards, like baseball or basketball player cards, have been bought and sold for over $1M. NFTs are kind of like a digital version of pokemon cards, they are collectible items or objects of interest that you can buy, sell, or keep. Sometimes, generative artists (artists who make artwork using computers, or computer algorithms) create pieces that are stored as a NFT.
NFTs
The emergence of NFTs has enabled a fascinating combination of two trends. The first is a very real resurgence of interest in collectible items across the world. People are buying and selling so many trading cards that there is even a $700M company specializing in verifying that a card is authentic, recently bought by entrepreneur Nat Turner. [Disclaimer: Nat’s biggest claim to fame is that he invested in Spring Health, a mental health company I founded, but he also founded his own $2B cancer company called Flatiron Health, and is one of the worlds biggest trading card collectors]. One nice technical feature of NFTs/digital collectibles is that authenticity is proven through the blockchain, so its really hard to fake an NFT as compared to faking a physical object like a Gucci handbag or trading card.
The second trend is in generative art— creators who develop their work by writing a computer algorithm that compiles the image according to the framework that the artist gives it.
ENTER, AUTOMATION
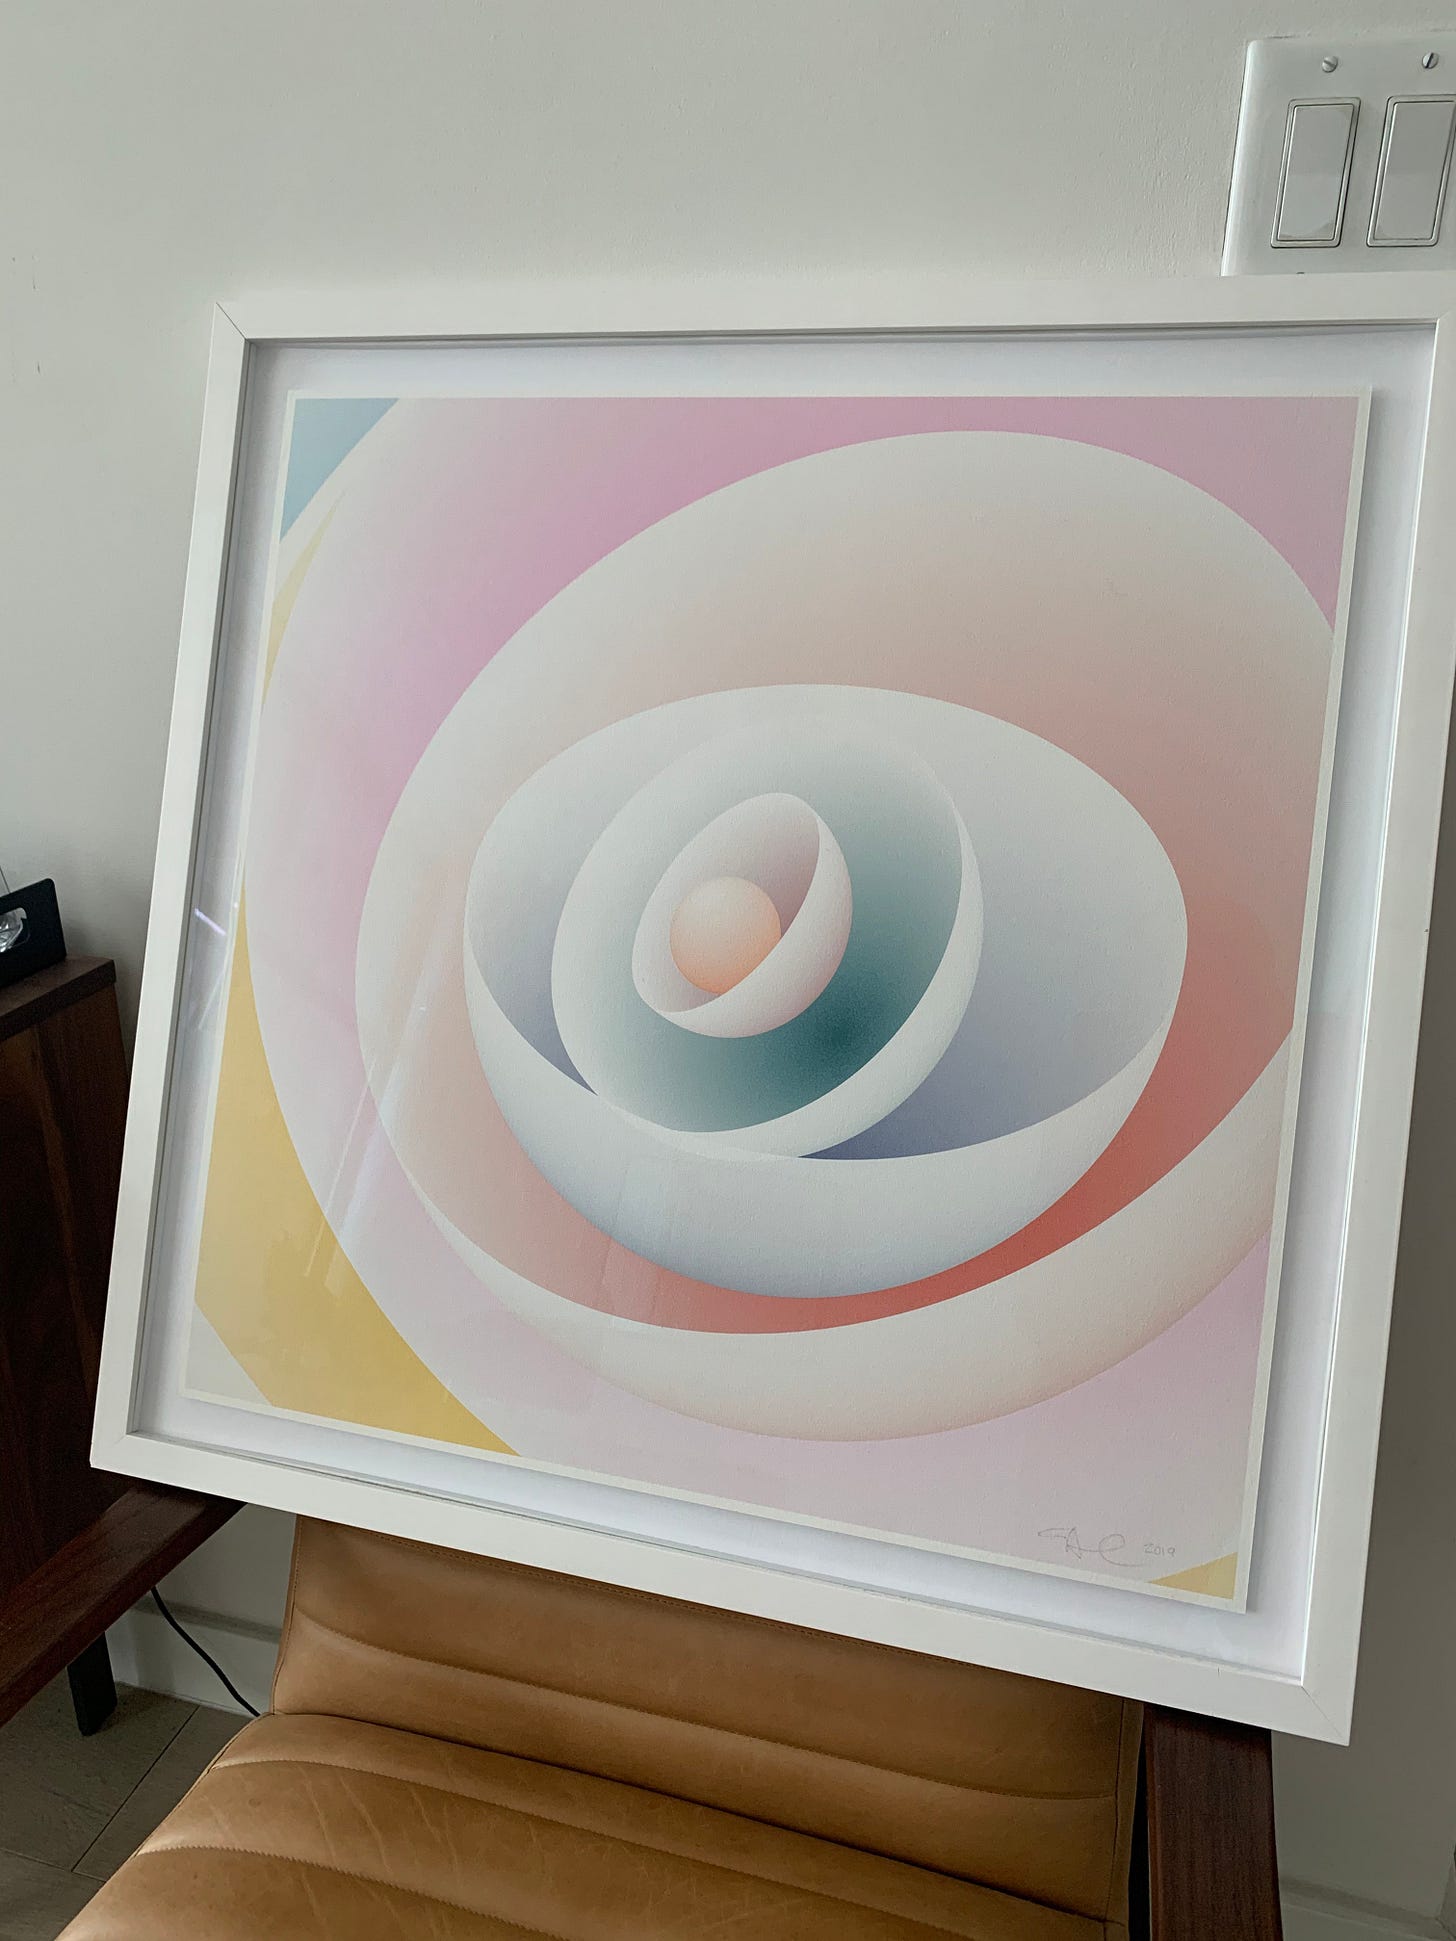
One notable example is Dmitri Cherniak who invents, designs, and then programs software that generates digital artworks.
The piece above was a single item (1 of 1), but creators will often use their generative models to create entire batches of outputs from the same original algorithm. Back in 2017 the first ever NFT was created by Larva Labs, a project called CryptoPunks released a batch of 10,000 collectible avatars.
RARITY
Establishing Rarity amongst these 10,000 CryptoPunks is shockingly similar to how rarity was established for Pokemon cards— mostly driven by scarcity and sometimes driven by visual preference. Certain attributes like blue skin or monkey faces are less common than others, and thus people are willing to pay more. There are only 9 alien CryptoPunks and thus they now sell for around $2-3M, compared to the 88 zombie CryptoPunks which sell for around $250k, compared to the 6,000 basic male CryptoPunks which sell for a floor of around $30k. Maybe a certain feature, like a cigarette, looks cool and has marginal influence on the price, but overall price is overwhelmingly dominated by the presence of a rare attribute.
RINGERS
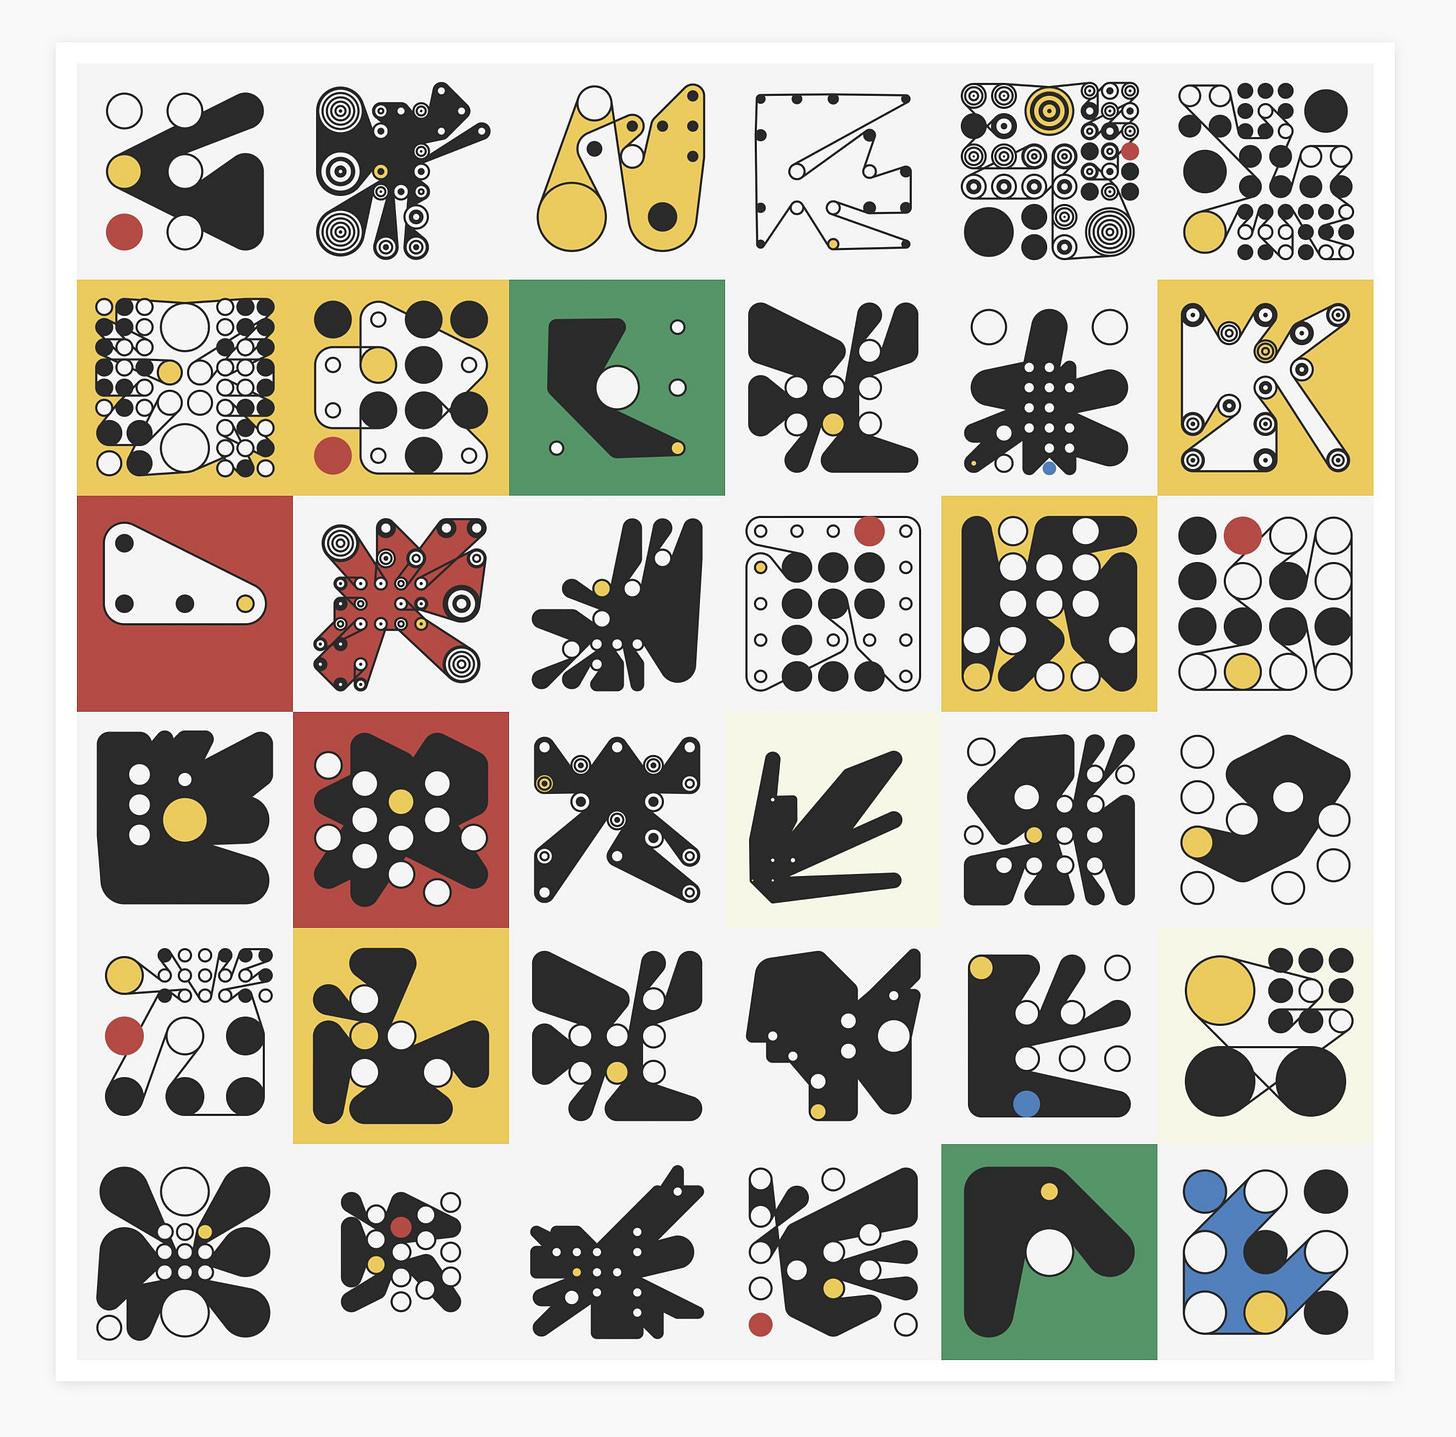
More recently Dmitri has used artblocks.io to tokenize a large series of generative works from a single algorithm, called Ringers:
There are an almost infinite number of ways to wrap a string around a set of pegs. On the surface it may seem like a simple concept but prepare to be surprised and delighted at the variety of combinations the algorithm can produce. Each output from 'Ringers' is derived from a unique transaction hash and generated in Javascript in the browser. Feature variations include peg count, sizing, layout, wrap orientation, and a few colorful flourishes for good measure.
As described in FIRSTEDITION.XYZ, Jake Brukhman says:
Ringers are visually stunning, structurally complex, and hold a lot of secrets and rarities, such as body fill, shrunken pegs, and minimal mechanisms. We hope you enjoy them as much as we do collecting them in wonder.
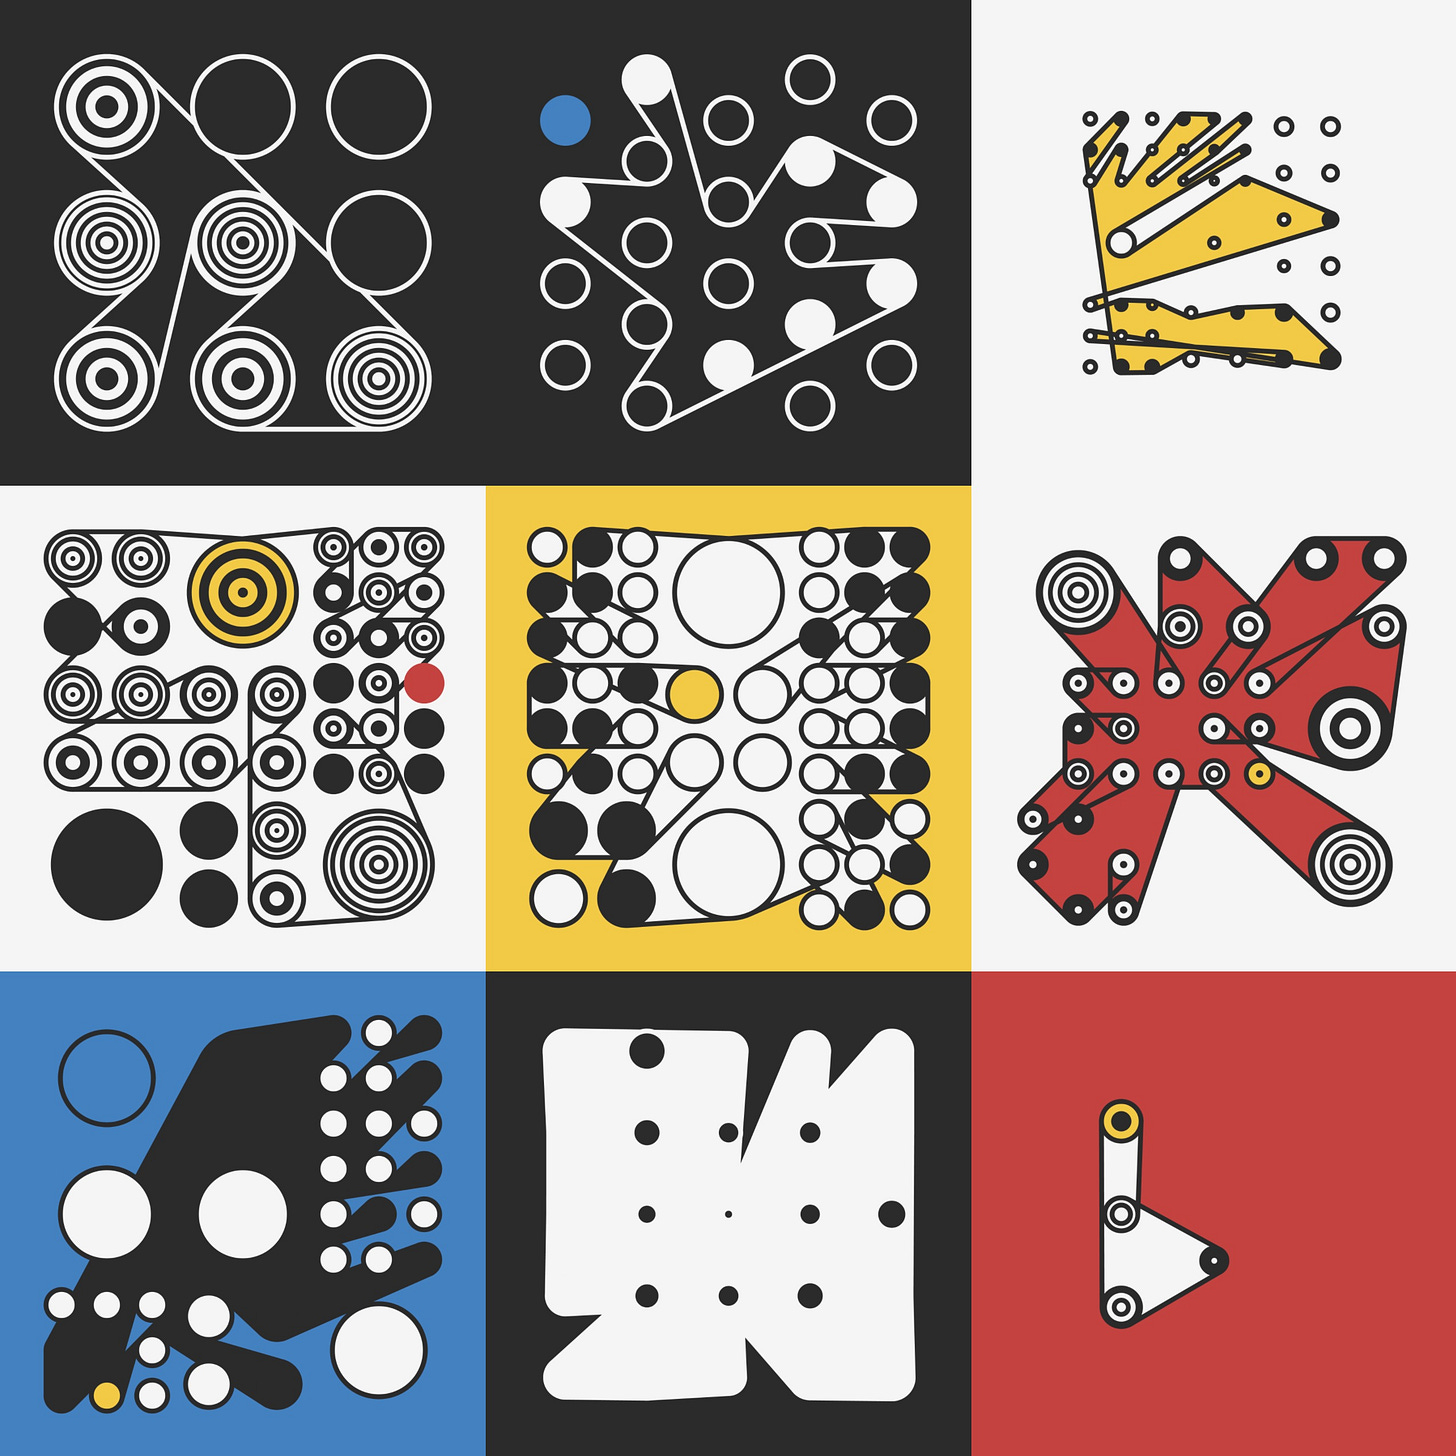
In short, Ringers is an algorithm that generates 1,000 unique images containing pegs with string wrapped around them. Each image is unique, generated upon creation based on parameters that are drawn from the transaction identifier. The original Ringer #000 (retained by the artist) is helpfully basic, showing a 4x4 layout with some black pegs, some white, and one yellow.
Each is of course unique, but there is considerable range across the whole collection of 1,000 ringers. Ringer #010 for example still has a 4x4 grid with white, black, and yellow pegs, but the pegs are smaller and the background is now yellow.
Others, like Ringer #373 have more striking irregular shapes and peg distributions, and a yellow fill.

Some features are rarer than others. Ringer #345 is one of just 75 Ringers to include “Bullseye” Pegs. Ringer #616 is one of just 4 Ringers to include a green peg. Which one is more rare? The green dot is a standout feature that is certainly not common, but everything else about #616 is extremely common. #345 has bullseye pegs and some invisible pegs.
Ringers are generated using around 21 different parameters. Sometimes we determine rarity based on a single feature or characteristic of the image that people decided to care about, like bullseye pegs. (Statistically, this is called the marginal probability). But I’ve only included a small and carefully selected examples to reduce complexity. In reality, Ringers are extremely diverse and the simple process of filtering based on one feature (or simple combination of obvious features) is highly reductive.
Every Ringer is unique. But how unique?
RINGER RARITY
I developed a statistical model to determine exactly how unique a particular Ringer is. It incorporates all of the 20 different parameters that define a Ringer.
and all possible values that a parameter could take. For example, backgrounds could be Beige, Black, Blue, Green, Red, White, or Yellow
You begin with the raw characterization of all Ringers, their settings, or genetic identity, if you will.
Next, for each feature, you replace the human readable factor (e.g. Background == White), with the observed probability of that event occurring (I.e. P(Backround = “White”). Cells that used to indicate “White Background” now are replaced with 0.802, the observed probability that a Ringer came out like that (there are 802 White Background Ringers out of the 1000). Cells that used to say Green Background are replaced with 0.002, the (much smaller) probability that a Ringer has a Green background
The same process is propagated through all observed characteristics of a Ringer, for all 1000 ringers and for all 20 characteristics.
As a final step, we calculate the joint probability distributed across all features by the chain rule of probability theory.
Essentially, the Rarity of a ringer is made up by figuring out how rare your Ringer is on each individual feature, and then multiplying that value across all 20 dimensions. Finally, we rank all 1000 ringers based on the raw probabilities to give us our Rarity Rank. Returning to the first 5 Ringers, we now see how rare each Ringer is in the context of all dimensions and probabilities, not just those that we as humans find visually appealing (like Bullseye pegs). Ringer #003 is statistically the 61st rarest Ringer. Ringer #004 is 848th rarest. Or, in other words, there are 847 Ringers that have statistically less likely combinations than Ringer #004.
DRUMROLL
Obviously, you want to know which is the rarest ringer. And so I oblige:
And the least rare:
GENETIC IDENTITY
Looking at the statistical genetics of ringers, I noticed many interesting phenomena. For instance, you’ll see in the table above that some ringers actually have statistically identical probabilities — usually because they are made up of the same combinations of features (e.g. basic 3x3 grid, white blue and yellow, nothing else).
There are exactly 60 sets of ringers that share the same genetic make up. Statistical siblings! 45 are statistical twins, 10 are triplets, 4 are quadruplets and there is even 1 octuplet.
The octuplets are 3x3 grids, with outer ring black, uniform pegs, & no additional pegs.

There are four sets of quadruplets. #s {253, 574, 835, 871}, {201, 302, 304, 584}, {085, 114, 295, 909}, and {326, 462, 548, 650}.

Remember — these groupings are done based purely on raw data, not based on any human interpretation of similarity. However, you can see that the process has uncovered visual similarity also.
DECOMPOSING RARITY
Ringers are unique, but considered as a set, some attributes are less common than others. This Rarity framework gives us a way of statistically ranking Ringers. But we can also ask which attributes are most influential in the statistical model?
There are many ways to pull this apart. One common way is to look at the variance of a feature. If a feature has low variance, it will be less influential in the model. For example, 495 Ringers have `All peg same type` and 505 do not. As a single feature, the value of `All peg same type` has basically no influence on rarity since it is just a coin flip either way. Other features have a highly uneven split, but still only two big buckets: `Outer peg fill` can either be black or white but only 139/1000 are white. It gives us some traction for splitting out rare vs common combinations. The most divisive attributes are those which do the best job of separating out subgroups: Background (out of 7), Grid (out of 12), Peg count (total), and Body (out of 5).
If we calculate & plot out the variance of each attribute, we have a better understanding of the factors that can have the biggest contribution to the overall probability of a specific Ringer existing.
Another, similar angle is if we train a machine learning model to predict the statistical Rarity of a ringer based on all of the features. The analysis is circular, obviously, but the feature importance of the model would also give us another lens to consider factors that determine how rare a ringer is. The answer is pretty similar.
CONCLUSION
Statistical rarity is only one factor that determines the price or willingness to pay for a collectible. People also collect based on who the author/artist, whether you personally like that item, and other immeasurable quirks, like Ringer #000 (the artists original), Ringer #001 (the first mint), #069 (lol), #420 (double-lol), #999 (buzzer beater minted in the final moment of creation).
I believe that as the field matures, statistical rarity will become a key attribute itself in determining the willingness to pay for a NFT. Here, I offered a formal way of calculating & exploring Rarity Ranks amongst NFTs within a collection. I strongly expect that over time, these models will account for a lot of the variance in price, and if I had access to the transaction data in an easier format, I suspect that the rarity is already correlated with the transaction price.
If you enjoyed this piece, please consider tipping: 0xcA8846DFD7DD8f535a8E9bAA0806cF4273460254
Adam (@itschekkers)


